Data Management Consultant
Tools & Solutions - Internship | JUN 2025 - Present
Managed data governance initiatives, implemented data quality processes, and optimized reporting dashboards.
.png)
Recent Software Engineering graduate with strong data skills and a passion for learning and growth. I turn complex challenges into clear insights and effective decisions through structured thinking and clear communication.
My Professional Experience
Tools & Solutions - Internship | JUN 2025 - Present
Managed data governance initiatives, implemented data quality processes, and optimized reporting dashboards.
Some of my technical and professional skills
Establishes policies and procedures to ensure proper use, quality, and compliance of data.
Proficient in querying and managing relational databases.
Skilled in scripting, data manipulation, and automation.
Proficient in organizing datasets, performing analysis with functions and formulas, and creating clear reports and dashboards.
Skilled in building dashboards, reports, and transforming data into meaningful insights.
Designs user interfaces and creates prototypes using Figma.
My professional certifications and completed courses

Check out some of my personal projects
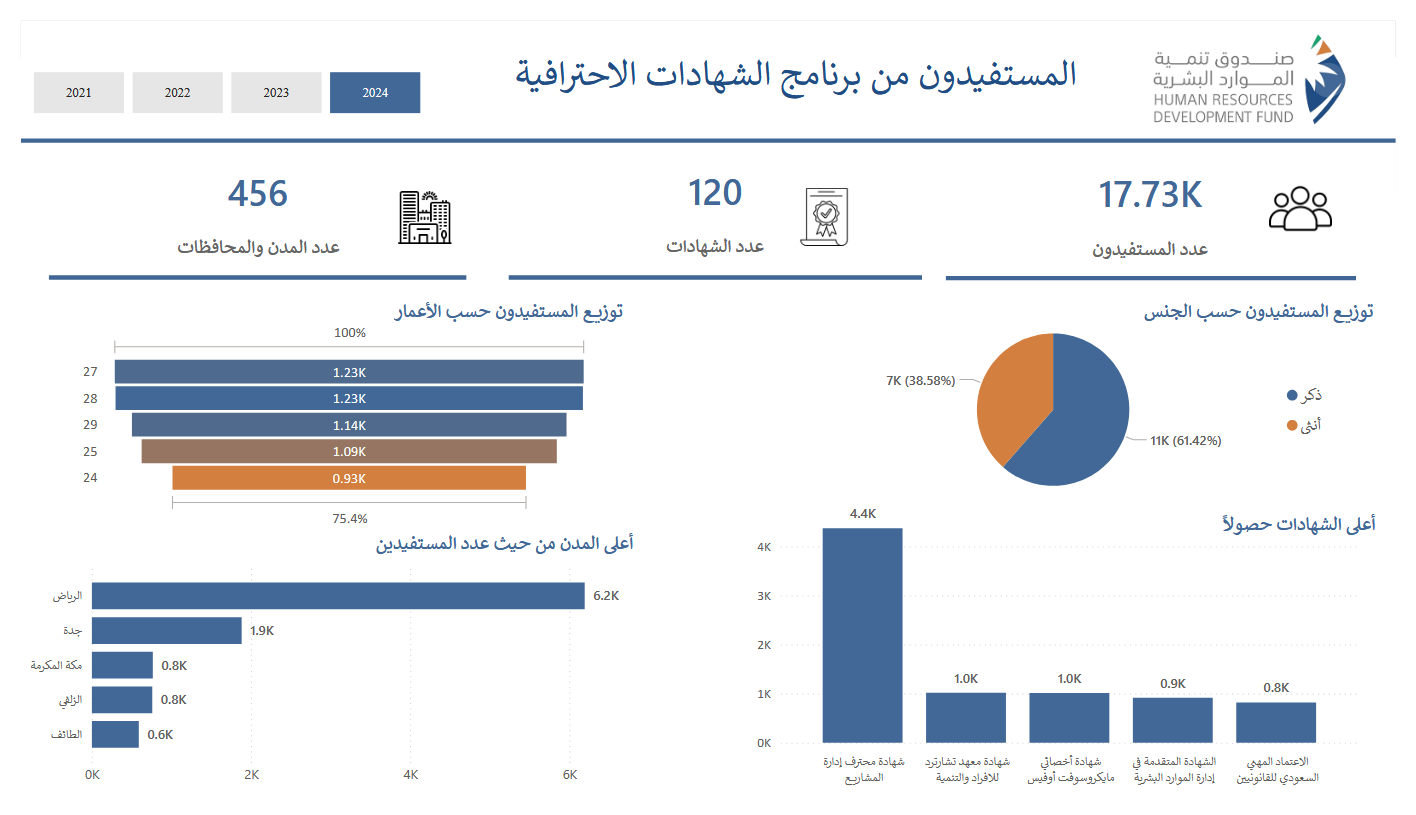
Collected, cleaned, and analyzed data from the Open Data Platform on professional certification beneficiaries for 2021–2024 to extract insights and support decision-making.
This project focuses on deploying and benchmarking Big Data frameworks on the cloud. I configured Amazon EMR clusters to process a large dataset of over 19 million records (BoardGameGeek reviews) stored in Amazon S3. The objective was to evaluate and compare the performance of Apache Hadoop and Apache Spark by executing Python processing jobs. The analysis covered key metrics such as execution time, resource utilization (CPU/Memory), and data handling capabilities across distributed nodes.
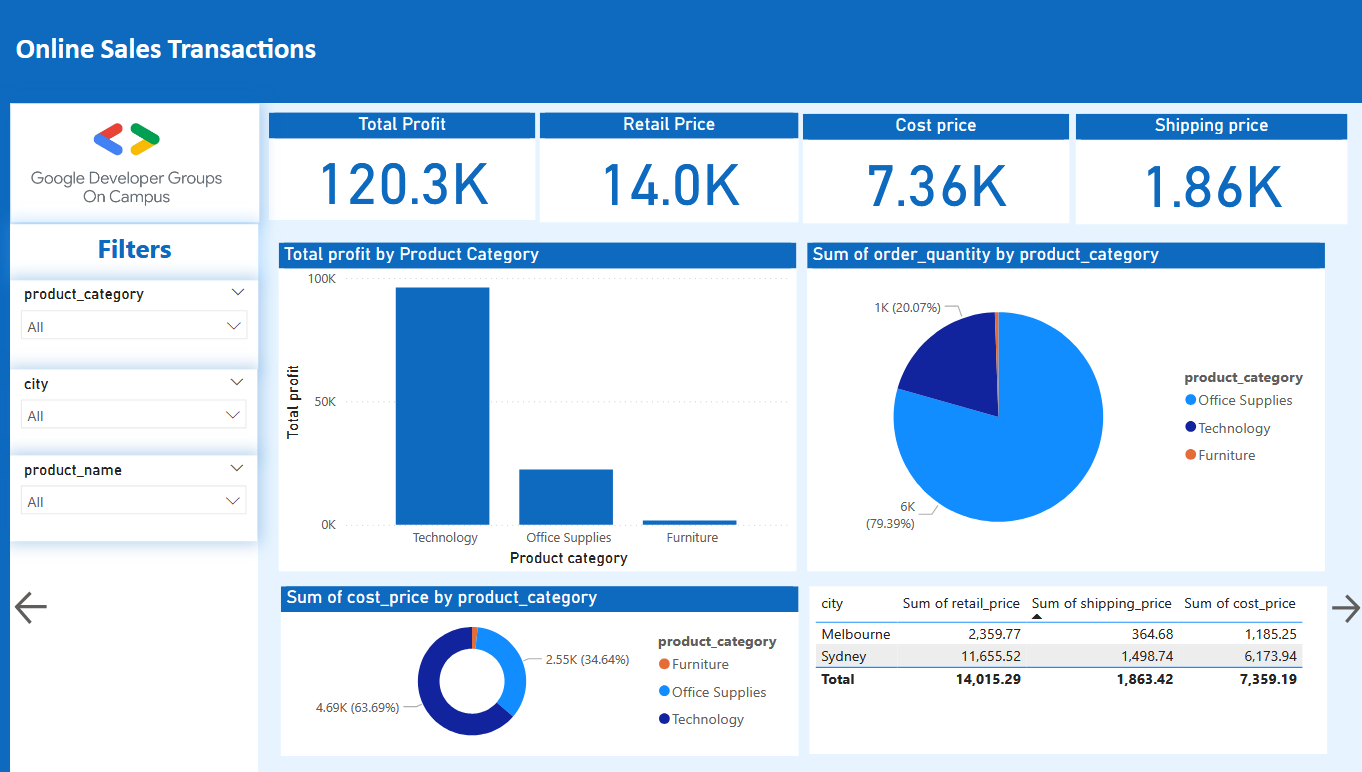
A comprehensive data analysis project that started with cleaning and processing raw global sales transaction data from Kaggle using Python. This was followed by the development of a dynamic dashboard in Power BI to visualize Key Performance Indicators (KPIs), identify sales trends, and highlight strengths and weaknesses across various product categories.